Client evidence / Anonymized

Results, with the measurement attached.

All 40 organizations are clients. The result evidence comes from direct measurement, independent reporting, public filings and vendor documentation. Every case is labeled with what we did and where the number came from, so you can judge the strength of the result for yourself.

Client portfolio40Dealership and auto-group clients
FEATURED01

Fixed Ops

+600

additional labor hours sold each month

Client profile

Two-rooftop service operation

Pre-arrival diagnostic capture across two stores

What changed

Customers answered structured questions while booking. Their symptoms, warning lights and supporting detail reached the technician before the vehicle entered the bay.

Why it mattered

Better information removed diagnostic delay and helped the stores sell roughly $180,000 in additional monthly labor at the documented labor rate.

Our role

Built the pre-arrival capture and the advisor handoff, and measured it with the stores.

Evidence source

Directly measured

FEATURED02

Scheduling

80→800

online appointments per month

Client profile

Single-point import dealer

Two-year service scheduling consolidation

What changed

A 28-step booking path became five steps for new customers and three to four for returning customers, connected to the store's mobile service operation.

Why it mattered

The gain came from removing friction and aligning booking with the way the department could actually fulfill the work.

Our role

Built the scheduling consolidation across the two-year window.

Evidence source

Directly measured

FEATURED03

Profit Discovery

$80k

missed monthly net profit surfaced

Client profile

Seven-store group

Cross-system reporting across inventory, incentives and sales history

What changed

The system found that payments were being processed before repair orders were closed, a process question management had not thought to ask.

Why it mattered

The value was not a dashboard. It was turning an unexpected pattern into a specific operating correction.

Our role

Built the cross-system reporting that surfaced the gap.

Evidence source

Directly measured

FEATURED04

Transformation Risk

−$73.3M

unrealized investment loss in one quarter

Client profile

National public dealer group

Major DMS replacement with an ownership stake in the platform vendor

What changed

The group backed a new intelligence platform intended to replace the DMS across North American stores.

Why it mattered

The U.S. pilot slipped by roughly a year and no operating result was attributed to automation. Strategic size does not remove implementation risk.

Our role

Not our build. Included as a documented failure case from public filings.

Evidence source

SEC-filed

FEATURED05

After Hours

$300k+

after-hours revenue

Client profile

Two-store domestic operation

24/7 service calls with live booking into the scheduler

What changed

The workflow booked 374 after-hours appointments, handled routine inbound service calls and connected directly to the scheduling system.

Why it mattered

The documented booking rate was 80% versus 57% for the prior in-house BDC period. The stores also recorded 4,906 human hours saved and 936 additional shop hours year over year.

Our role

Built the after-hours booking into the live scheduler.

Evidence source

Directly measured

FEATURED06

Lane Inspection

~1 min

inspection versus 10–15 minutes manually

Client profile

Single-point domestic service department

Automated drive-through inspection replacing manual condition capture

What changed

The lane system created consistent visual evidence for tire and alignment conversations at check-in.

Why it mattered

Tire sales rose 30% year over year and alignments rose 77%.

Our role

Built the automated condition capture.

Evidence source

Directly measured

The full index

All 40, filtered how you want them.

Filter by the part of the store you care about, or by how strong the evidence is. Nothing here is hidden behind a form.

Showing 8 of 40 cases.

+600

additional labor hours sold each month

Customers answered structured questions while booking. Their symptoms, warning lights and supporting detail reached the technician before the vehicle entered the bay.

Better information removed diagnostic delay and helped the stores sell roughly $180,000 in additional monthly labor at the documented labor rate.

Our role

Built the pre-arrival capture and the advisor handoff, and measured it with the stores.

Evidence source

Directly measured

Client profile

Two-rooftop service operation

17 hrs

faster diagnostic RO closure

The same symptom-capture method was measured against the repair-order clock instead of revenue.

The typical open duration for comparable work had been about 40 hours. The workflow attacked waiting, not technician judgment.

Our role

Built the pre-arrival diagnosis flow and set the RO-duration baseline.

Evidence source

Directly measured

Client profile

Metro luxury store

61→76%

customer video view rate

Every technician walkaround was checked for visible evidence, required tire and brake measurements and inappropriate language.

Quality control made the content more useful to customers and gave managers a coaching queue instead of a random sample.

Our role

Advised on the grading rubric and the review queue. The store ran the volume.

Evidence source

Vendor-reported

Client profile

Large monthly video operation

80→800

online appointments per month

A 28-step booking path became five steps for new customers and three to four for returning customers, connected to the store's mobile service operation.

The gain came from removing friction and aligning booking with the way the department could actually fulfill the work.

Our role

Built the scheduling consolidation across the two-year window.

Evidence source

Directly measured

Client profile

Single-point import dealer

113 / 58

calls handled / appointments booked on one Monday

The group rolled out voice and messaging in sequence, captured overflow, responded in about 30 seconds day or night and kept the handoff visible.

Shopper engagement with automated messages rose from 19% to 41% over roughly four months.

Our role

Built the voice overflow and SMS handling and measured both against the prior baseline.

Evidence source

Directly measured

Client profile

Employee-owned multi-rooftop group

14 days→seconds

offer-management cycle

A dealer-built layer connected DMS, CRM, website and phone history so staff could ask business questions and act from the same one trusted record with controlled access.

The group also documented that 38% of customer engagement occurred after hours, giving leadership a precise reason to change the workflow.

Our role

Built the query layer over the group's existing operating data.

Evidence source

Directly measured

Client profile

Regional group with an internal data layer

$80k

missed monthly net profit surfaced

The system found that payments were being processed before repair orders were closed, a process question management had not thought to ask.

The value was not a dashboard. It was turning an unexpected pattern into a specific operating correction.

Our role

Built the cross-system reporting that surfaced the gap.

Evidence source

Directly measured

Client profile

Seven-store group

400 hrs

employee time recovered each month

A decades-old reporting path was replaced with a governed data platform and management analytics.

Employees stopped waiting on a single service-department report and more than four billion records became queryable.

Our role

Built and operated the ingestion and query layer.

Evidence source

Directly measured

Client profile

Large multi-rooftop data operation

What counts as a win

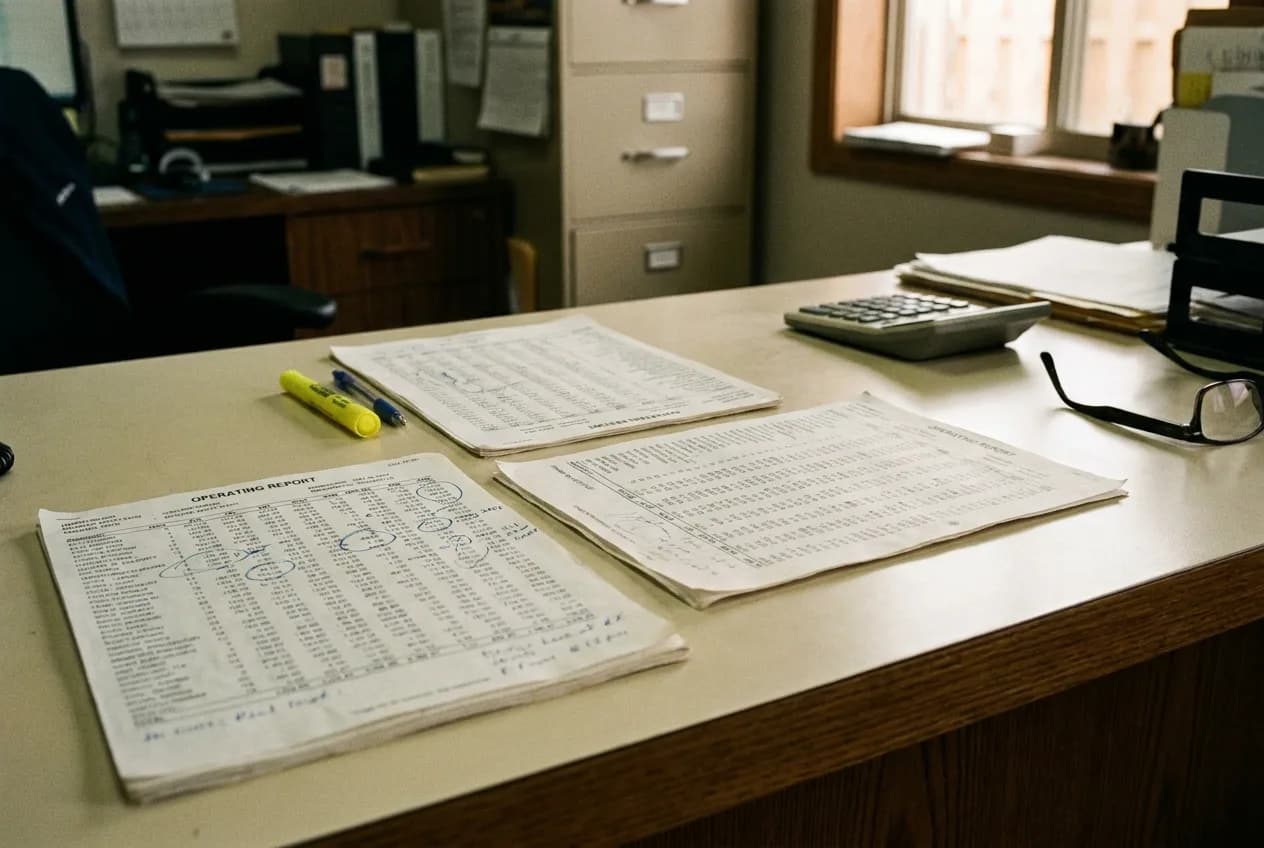
Printed monthly operating reports on a desk, one annotated in pen, with a highlighter and calculator
Where claims get checkedFig. 03

Count the outcome only when the path can be reconstructed.

01

Baseline

Volume, delay, error and cost before the build

02

Event record

Original trigger, source record and time

03

Decision trail

Rules, exception, approval and action

04

Downstream result

Appointment, RO, sale, gross or prevented loss

05

Net effect

Real operating gain after software, media and labor

Content volume, chatbot conversations and AI-set appointments are intermediate events. They become proof only when the dealership can see what happened next.

Dealer Automation Audit

Build your own baseline before buying another tool.

The audit identifies a measurable event chain and the data needed to prove whether a pilot changed the store.

Start the audit